Documents index

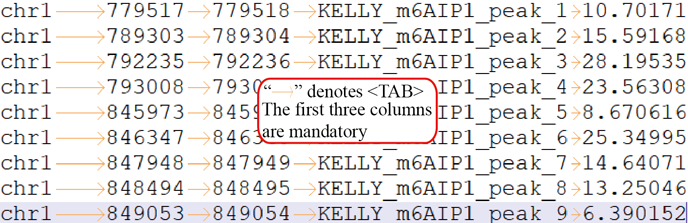
BED lines have three required fields and nine additional optional fields (UCSC introduction). The first three required BED fields are:
- chrom - The name of the chromosome (e.g. chr3, chrY, chr2_random) or scaffold (e.g. scaffold10671).
- chromStart - The starting position of the feature in the chromosome or scaffold. The first base in a chromosome is numbered 0.
- chromEnd - The ending position of the feature in the chromosome or scaffold. The chromEnd base is not included in the display of the feature. For example, the first 100 bases of a chromosome are defined as chromStart=0, chromEnd=100, and span the bases numbered 0-99.
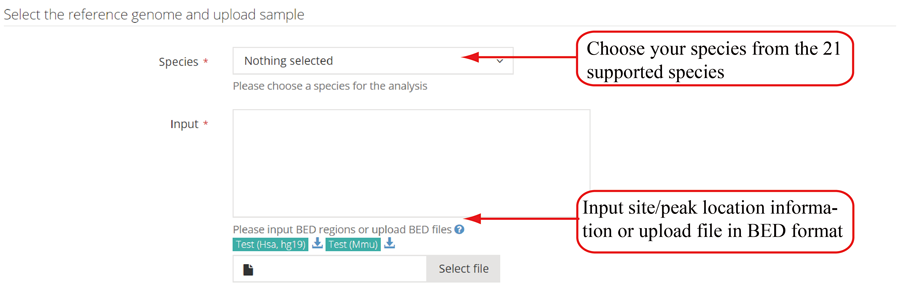
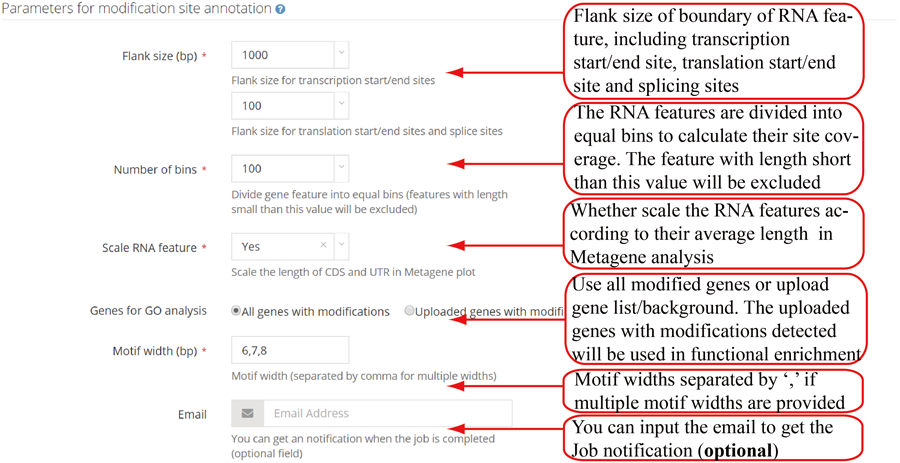
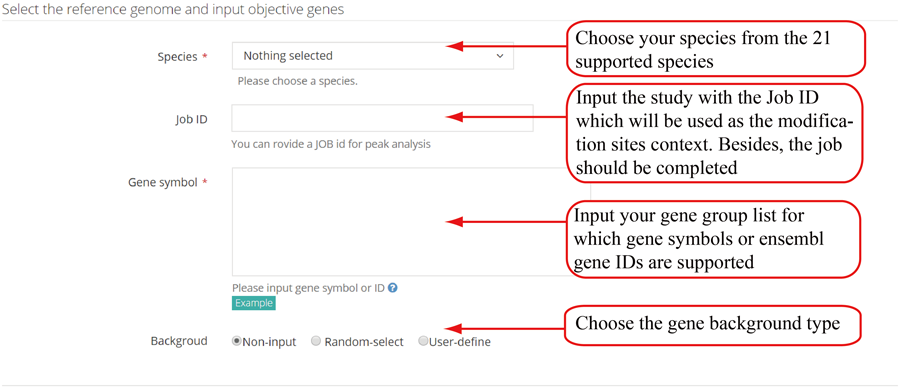
Parameters for single case. RNAmod provides users several parameters to flexibly re-define the mRNA features. The first parameter is flank length interval (upstream and downstream), which can be used to define the transcription site/end site genomic boundary regions, and transcriptic boundary regions of translation start/end site and splice site. The second is the number of bins in which to divide the gene features for coverage plots. The third is the parameter controlling whether scale the UTR length to CDS length in the shape of metagene plot curve. The fourth is the lengths of the motif (multiple lengths are separated by comma ',' such as 5,6 and 6,7,8) in the enriched motif identification. It is note that users can choose using the whole methylated genes or defining specific gene subset/background with modification detected to perform functional analysis.
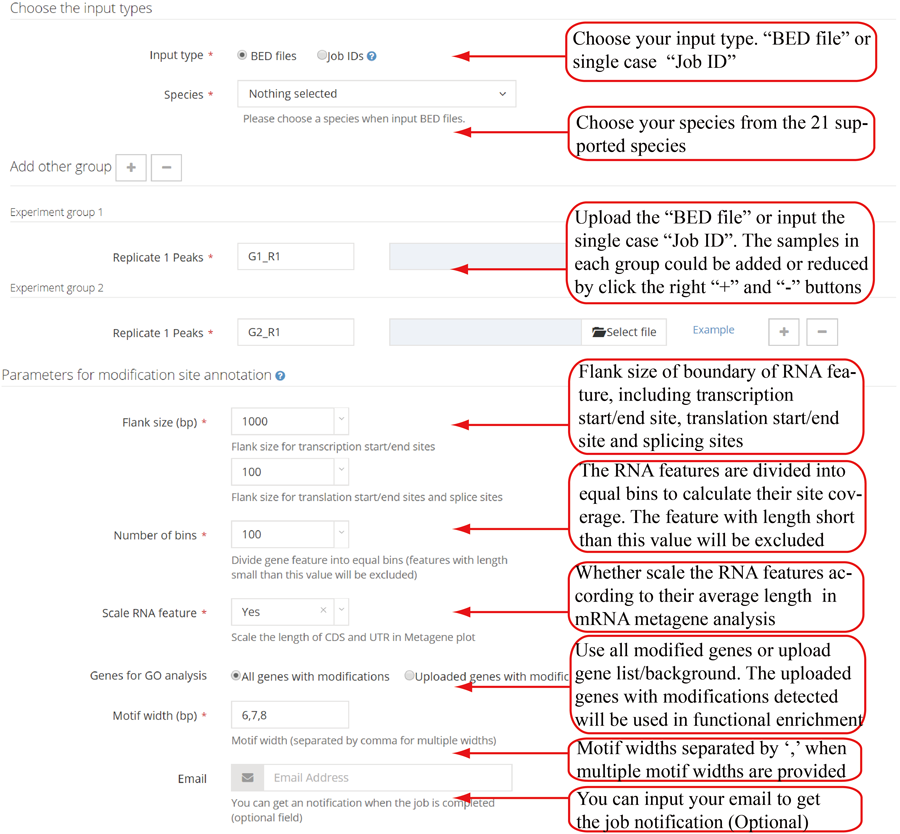
Parameters for group case. The first parameter is flank length interval (upstream and downstream), which can be used to define the transcription site/end site genomic boundary regions, and transcriptic boundary regions of translation start/end site and splice site. The second is the number of bins in which to divide the gene features for coverage plots. The third is the parameter controlling whether scale the UTR length to CDS length in the shape of metagene plot curve. The fourth is the option to choose using the intersection of replicates or union of replicates. The fifth is the lengths of the motif (multiple lengths are separated by comma ',' such as 5,6,7) in the enriched motif identification. It is note that users can choose using the whole methylated genes or defining specific gene subset/background with modification detected to perform functional analysis.
Parameters for gene based study. The first is the job ID of the study which defines the modification context. The second parameter is user's gene list, which is used to compare the modification distribution and annotation difference between these genes and other background genes. The third is to choose the background gene types.
After job is submitted, the web server will give the user a Job ID, which can be used to retrieve the results and perform the comparative analysis in group case study.
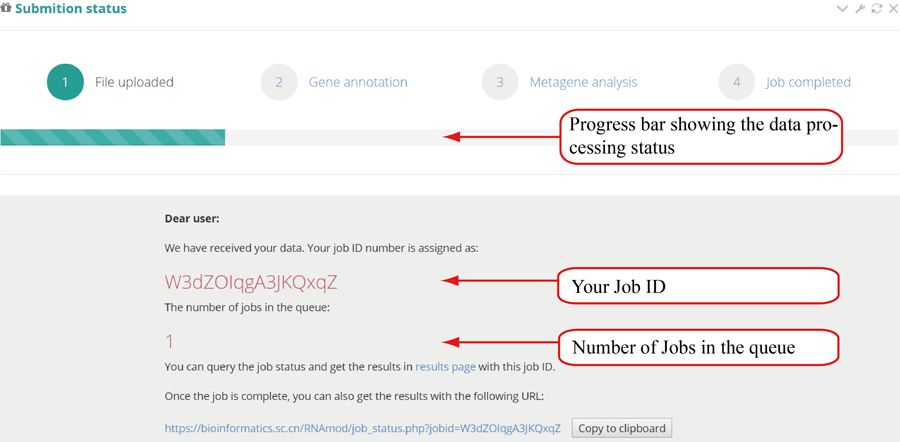
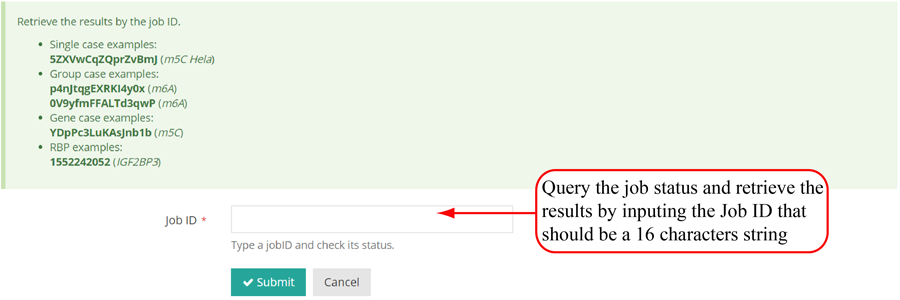
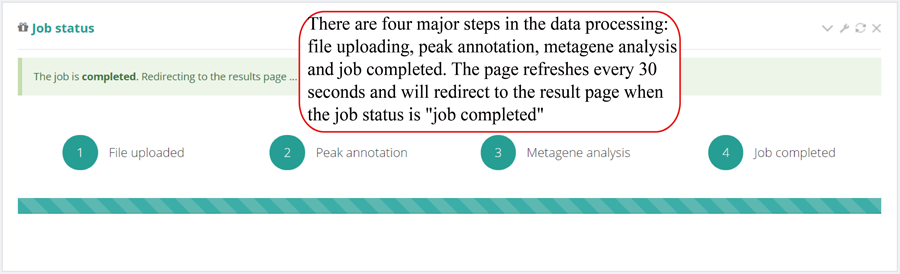
Query the job status. There are four major steps in the data analysis process: 'file uploading', 'peak annotation', 'metagene analysis' and 'job completed'. The page refreshes every 30 seconds and will redirect to the result page when the job status is "job completed". In result pages, all the results are showed in high-quality interactive figures and tables. The figures generated by highcharts.js can be downloaded in PNG, JPG, PDF and SVG formats while the table formated by DataTables.js can be download in CSV, Excel and PDF formats.
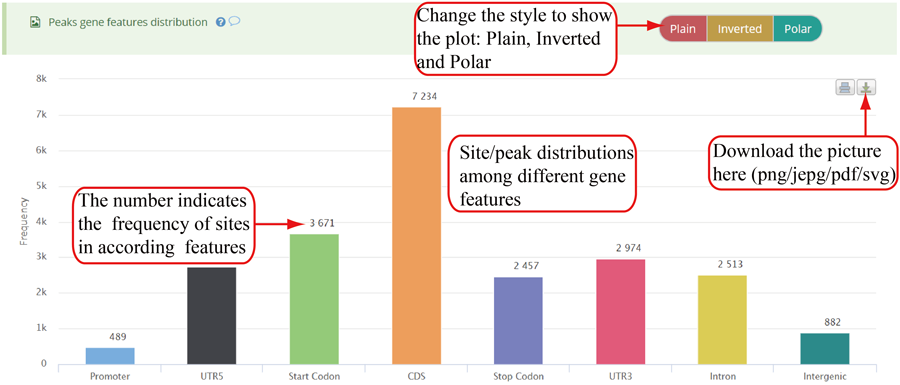
Modification sites/peaks distribution on different gene features, including Promoter, 5'UTR (UTR5), CDS, 3'UTR (UTR3), Stop codon, Intron and Intergenic region. Y-axis denotes the frequency of peaks/sites (number of peaks/sites) while x-axis represents different gene features. The numbers on the bar indicates the frequency of peaks/sites distributed on according gene feature. The plot can be showed in three different forms: 'Plain', 'Inverted' and 'Poplar' and the plot can be exported in png, jpeg, pdf and svg formats. It is noted that the stop codon is overlapped with 3'UTR and CDS.
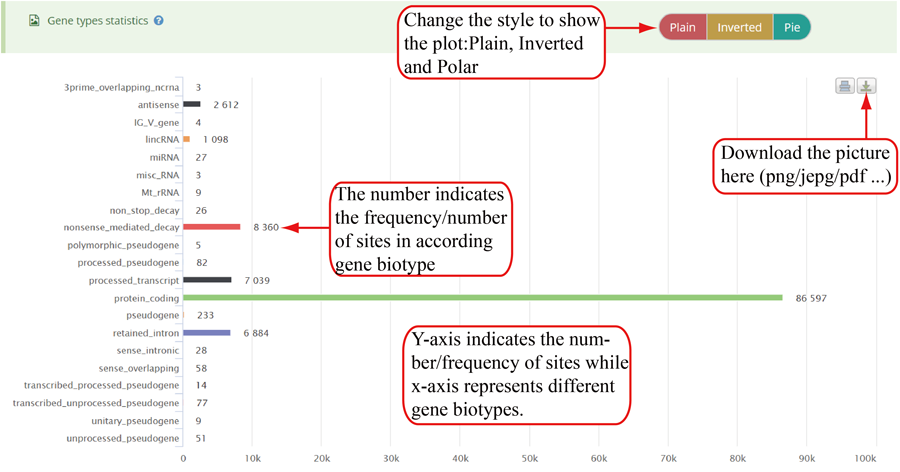
Modification sites/peaks distribution on different gene biotypes, such as protein coding gene, lncRNA, pseudogenes, rRNA, and miRNA. Y-axis indicates the frequency of peaks/sites (number of peaks/sites) while x-axis represents different gene biotypes. The numbers on the bar indicates the frequency of peaks/sites distributed on according gene biotype. The plot can be showed in three different forms: 'Plain', 'Inverted' and 'Pie' and can be downloaded in png, jepg, svg and PDF formats.
Coverage plot for modification sites/peaks overlapping with different mRNA features. After excluding the features shorter than specific length, each gene feature is divided into bins (100 bins by default) in equal size. The value of the length threshold equals to the number of bins. The number of sites/peaks distributed in each bin is counted and the mean coverage is then calculated among all the according features. X-axis represents the bins (5' → 3' direction) while Y-axis indicates the mean coverage. In the plot, ribbons represent the mean coverage while the thickness of ribbon shows the 95% confidence interval (±standard error x 1.96).

Coverage plot for modification sites/peaks around transcription start sites and translation end sits. The number of site/peaks for each location is counted around the flank regions (upstream and downstream,1000 bp flank size in default). The mean depth of coverage for that location is then calculated for all the genes. X-axis represents the nucleotide location around the site (5' → 3' direction) while Y-axis is the mean depth of coverage. In the plot, ribbons represent the mean coverage while the thickness of ribbon shows the 95% confidence interval (±standard error x 1.96).
Coverage plot for modification sites/peaks around translation start sites (TSS) and translation end sits (TES). The number of site/peaks for each nucleotide location is counted around the flank regions (upstream and downstream) of TSS/TES on the transcript. The mean depth of coverage is then calculated for all the genes. X-axis represents the nucleotide location around the site (5' → 3' direction) while Y-axis is the mean depth of coverage. In the plot, ribbons represent the mean coverage while the thickness of ribbon shows the 95% confidence interval (±standard error x 1.96).
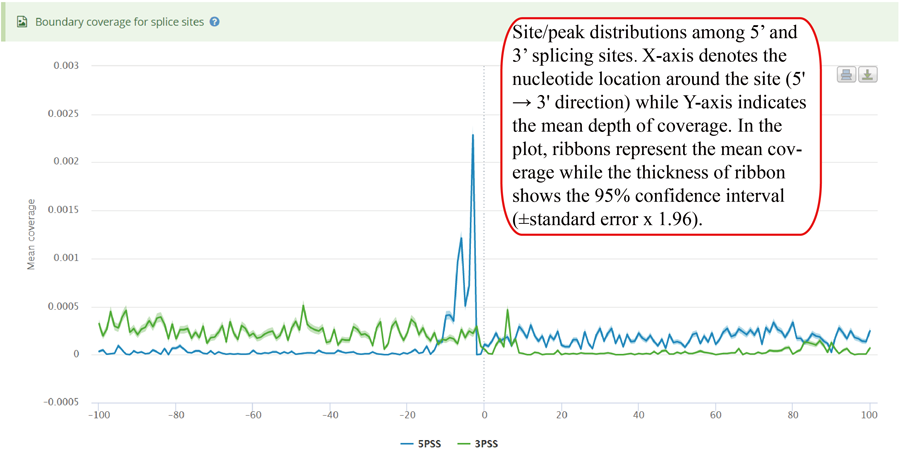
Coverage plot for modification sites/peaks around 5' splice sites and 3' splice sites. For the coverage analysis around splice sites, the number of site/peaks in each location is counted. Then, mean depth coverage for specific location is calculated for all the genes. X-axis represents the nucleotide location around the splice site (5' → 3' direction) while Y-axis indicates the mean depth of coverage. In the plot, ribbons represent the mean coverage while the thickness of ribbon shows the 95% confidence interval (±standard error x 1.96).
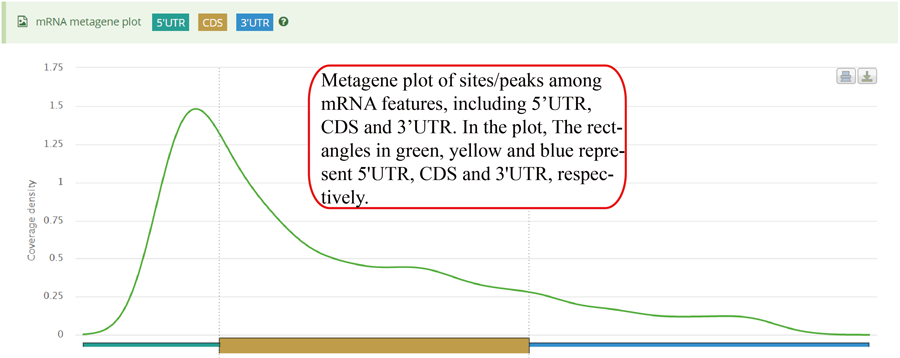
mRNA metagene plot. After excluding the gene with any of the mRNA features (5'UTR, CDS and 3'UTR) shorter than specific length, each mRNA feature was divided into bins with equal size (100 bins by default). The value of the length threshold equals to the number of bins. The number of sites/peaks distributed in each bin is counted. Then,the mean coverage in each bin is calculated among all the genes. The rectangles in green, yellow and blue represent 5'UTR, CDS and 3'UTR, respectively. Y-axis denotes the density distribution of coverages.
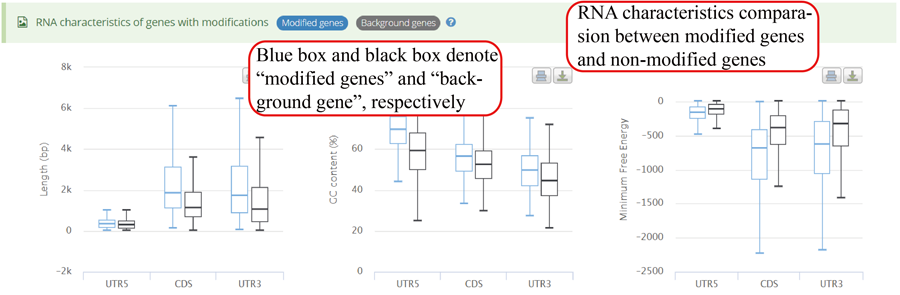
mRNA characteristics statistics between genes with modifications and other background genes. Y-axis in three plots (from left to right) represents length, GC content and minimum free energy (MFE), respectively. The blue bar and black bar represent modified gene and other background genes, respectively.
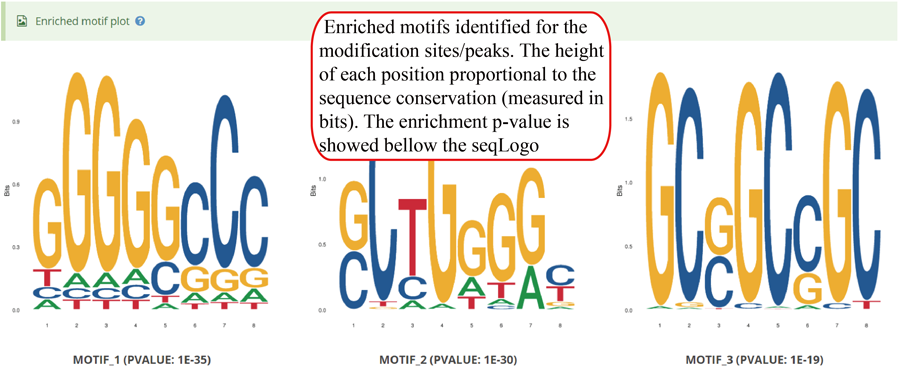
Enriched motifs detect by Homer for the modification sites/peaks. The seqLogo plots for enriched motifs (top 5 as default) are showed, in which, the logo use a stack of letters to represents columns of the alignment and the height of each stack proportional to the sequence conservation (measured in bits) at that position. The enrichment p-value is showed bellow according seqLogo plot.
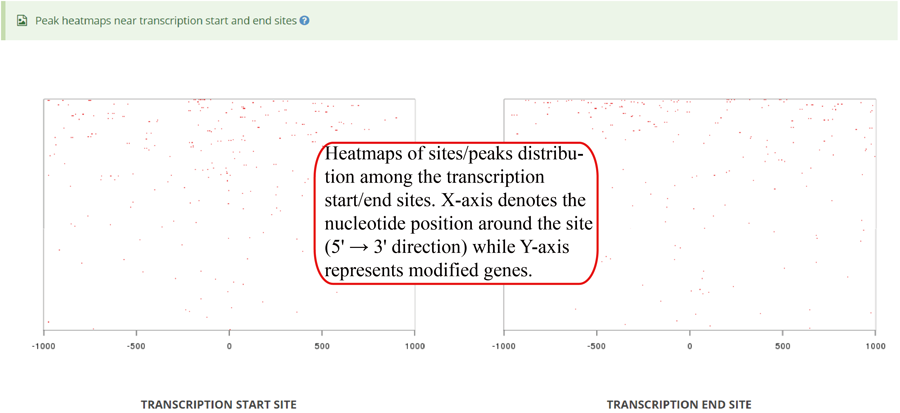
Heatmap of modification site/peaks around transcription start sites and transcription end sites (genomic regions). X-axis represents the nucleotide position around the site (5' → 3' direction) while Y-axis represents all modified genes which is sorted by the number of modifications in each gene. In the plot, the red color scale evaluates the depth of coverage.
Heatmap of modification site/peaks among translation start sites and translation end sites (transcriptic regions). X-axis represents the nucleotide position around the site (5' → 3' direction) while Y-axis represents all modified genes which is sorted by the number of modifications in each gene. In the plot, the red color scale evaluates the depth coverages.
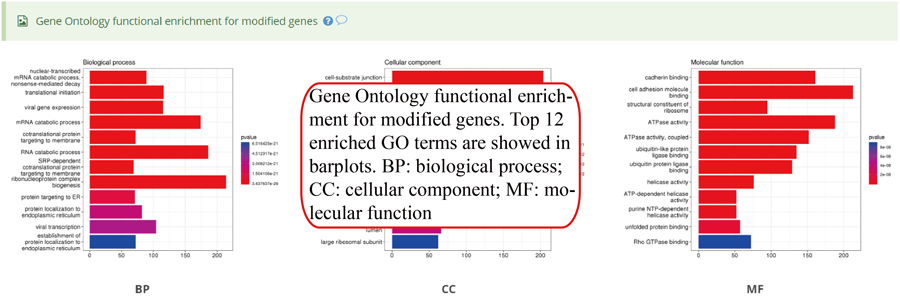
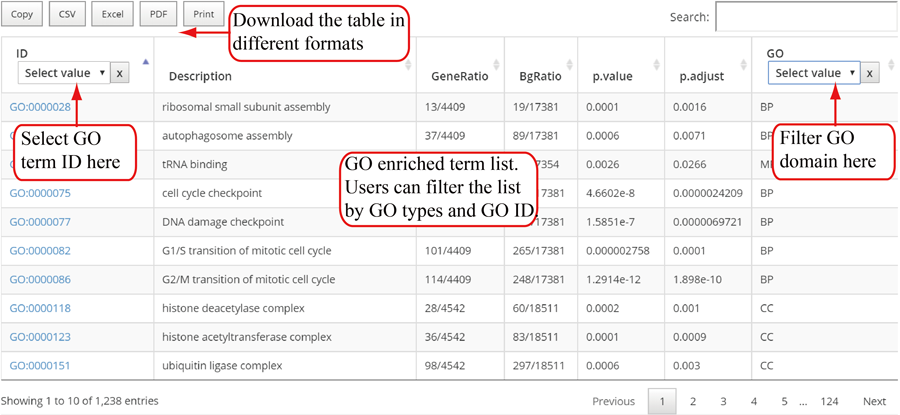
Gene Ontology (GO) functional enrichment for genes with modifications. Top 12 enriched terms are show in the bar plots. Y-axis in the bar plot indicates number of genes in according GO term. The color scale represent the enrichment p-value. All the enriched terms in three GO domains (biological process, cellular component and molecular function) are contained in one table and use filter in 'GO' column to select specific GO domain terms. A blank picture indicates that there is no significant enriched terms for that GO domain.
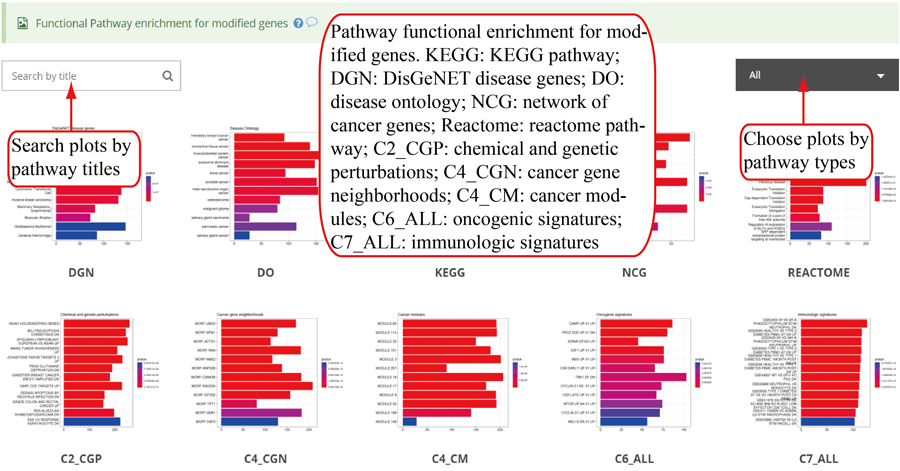
Functional pathway enrichments for genes with modifications, which include KEGG for all 21 species, Reactome pathway, Disease Ontology, Network of Cancer Gene, DisGeNET disease genes and MSigDB functional gene sets (chemical and genetic perturbation genes, microRNA target motf genes, cancer gene neighborhoods, cancer module genes, oncogenic signature genes and immunologic signature genes) for human, mouse, rat, zebrafish, fly and C.elegans. Top 12 enriched pathways are show in the barplots. Y-axis in the barplot indicates number of genes in according pathway category. The color scale represent the enrichment p-value. All the enriched pathway in different pathways are contained in one table and use filter in 'Type' column to select specific pathway. If there is no data for specific pathway category, there will be no picture for that pathway. Beside, a blank picture indicates that there is no significant enriched pathway for that pathway category.

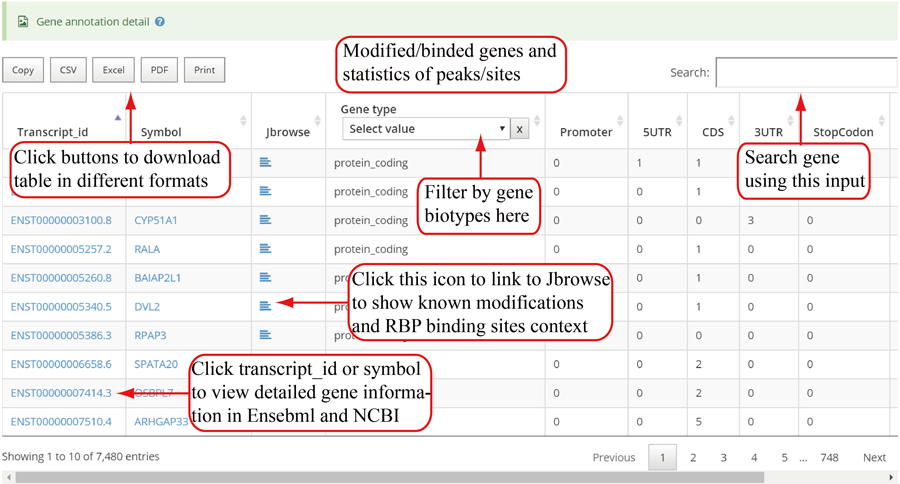
The detail list of genes containing modification sites/peaks. The gene information include transcript ID, gene symbol and gene biotype (gene_type). It is note that 'Stop codon' region is overlapped with 3'UTR and CDS. Click icon to compare the modifications in these genes with known modifications and RBP binding sites in JBrowse and click the transcript_ID to show the detailed gene information in Ensembl database.
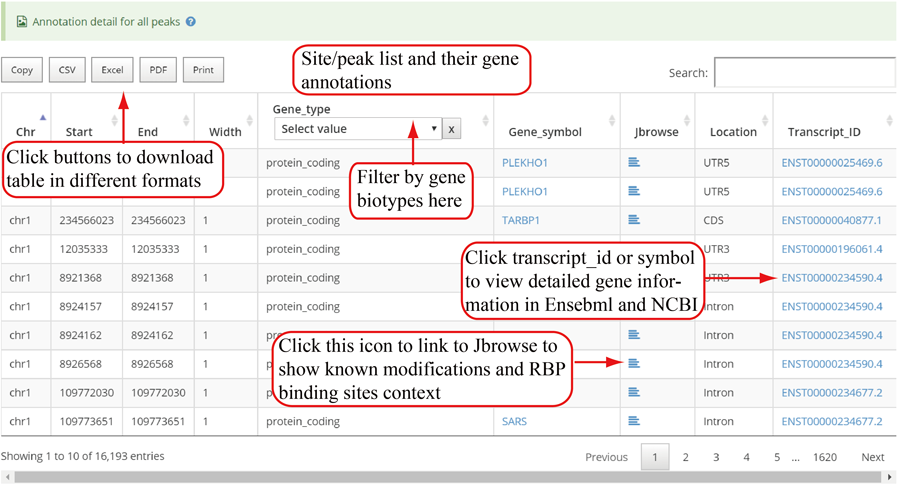
Detail annotation list of sites/peaks. The gene information for the peak include transcript ID, gene symbol, gene biotype (gene_type) and location on according gene. Click icon to compare the modification with other known modifications and RBP binding sites in JBrowse while click the transcript_ID to show the detailed gene information in Ensembl database.
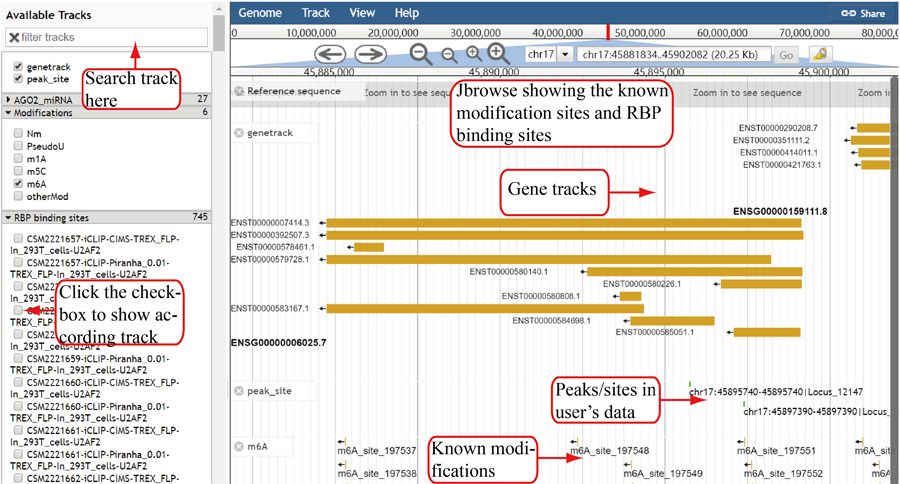
Jbrowse is used to show the known modification sites and RBP binding sites. The tracks are organized into three groups: basic genome information tracks, RNA modification tracks and RBP binding-site tracks. The track of user's modification are showed automatically and click the checkbox in left window to show other tracks. Meanwhile, the tracks can be searched by inputing the modification type or RBP name.
| Browser name | Version |
|---|---|
| Internet Explorer | 11 |
| Chrome | 70.0.3538.80 |
| Firefox | 66.0 |
| Safari | 5.1.7 |